 Fridays with Vicky 130
Writing this we are already in July. It’s summer, we are all busy enjoying the sun, the beach, the summer break with your kids (if you have children) so I’ll keep the June Case Study income report short and sweet.
Why Do I Share the Numbers and Stats of this Site?
I have two main reasons to share the detailed information in these case studies.
1. To give you insight, to show you the roller coaster of a website. How things can truly go from the lowest low to high. I’m as transparent as I feel I can be sharing traffic, income, rankings, expenses and more. Hopefully, it will give you an idea what it could be like running your own blog or website.
2. It helps me keep track of all the stats, it also helps me be accountable for my site.
The Case Study Site
If you’ve been following the case study for a while you know what the site is about but if you’re new, let me just briefly share the requirements I had when I first started with it.
- The site had to be hands-off, based on mostly outsourced content.
- The site had to be in an evergreen niche, I chose the health niche.
- The site had to be monetized with Amazon.
Today, I would say 98% of the content is outsourced. I’ve been very lucky to find great writers with field experience. The health niche is huge so there are unlimited sub-niches to explore and focus on. The site is mainly monetized with Amazon, but I’ve also taken on another affiliate program the last couple of months, that has proven (especially last month) being a great fit for the site.
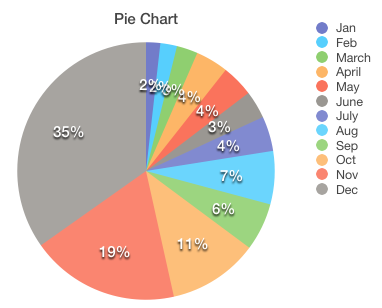
The main sub-niches are focused on winter month related products, which gives the site a natural peak during the colder months. I can see that now when summer is here, the results are dipping due to main niches being cold related.
I’ve worked hard, or my writers have worked hard, to focus in on some more all-year around niches, but it’s taking time to get traction, but we’ll get there.
That was another thing with this site. It started as a side project and main focus was to build it slowly over time with great content that ranks organically in Google and other search engines.
All though the result is down this month compared to May, I’m excited to see the progress from last June. It shows that we are still on the right track.
Let’s dive into the numbers.
Traffic Progress
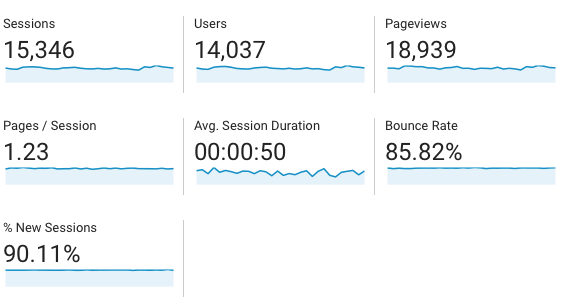
May 2017
- Sessions 15.986
- Users 14.534
- Page views 20.462
- Session duration 57 sec
June 2017
- Sessions 15.346
- Users 14.037
- Page views 18.939
- Session duration 50 sec
I know that numbers would probably be down in June, my main concern is that the session duration is dropping… This is kind of a double-edged sword, if they click through and purchase something then that’s fine but if they are dropping off because they don’t find what they are looking for then that’s an issue…
Have to keep an eye on this for sure.
Content
I get pretty much all my traffic from content ranking organically in Google and other search engines. Good content, that is search engine optimized to rank well.
In June I kept my writers busy, scheduling blog posts for September and October. I love the scheduling feature in WordPress! It allows me to stay ahead of schedule.
For June I had 4 blog posts scheduled weekly. Two general posts, one review and one miscellaneous depending on what the site needed.
The best traffic generators are still from the first sub-niches that I worked with, I hope that the later ones will catch up and pull in some good traffic as well. Posts like “Top 5” and “5 Ways to” are still ranking well and bringing in traffic.
My Top 5 Traffic Generating Posts Are…
- Top 5… sub-niche 2 (cold month related)
- 5 Best… sub-niche 4
- Top 10… sub-niche 1 (cold month related)
- 5 Ways to… general article
- 5 Ways to … (cold month related)
The cold month related niches are still bringing in traffic. These posts and pages rank well, so let’s look at the ranking results for this site.
Ranking Result
Since the site depends on the rankings generating the traffic, this is an important factor to keep a close eye on. What I’m looking for is natural growth over time. Individual rankings will go up and down but I’m looking for overall ranking growth for the site.
My favorite site to use for this is SEMRush. They give me a quick overview of what’s going on ranking wise with the site. Since the cold month niches still bring in the traffic, traffic might be down during the warmer months, BUT if we keep and gain rankings we are still on the right track and traffic should increase with time.
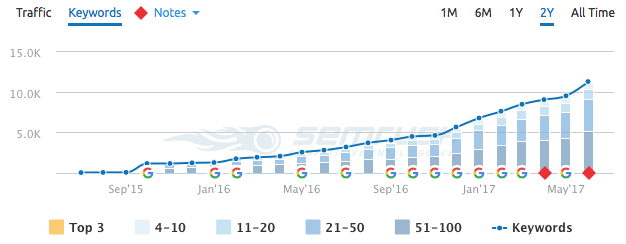
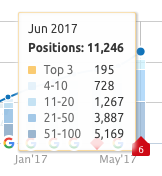
Total rankings of 9,494 in May and 11,246 in June I like the increase in rankings! Looking at the top 3 rankings, we went from 146 to 195, nice.
When checking the rankings I also check if there’s been any major Google updates or changes…
Google Changes
According to SEMRush, there was High Activity for US desktop database on 6 occasions in June which could indicate Google changes or updates. If there were, it looks like it was to our advantage.
Case Study Income Report and Sales Result in June 2017
In May our independent program generated more commission than the Amazon affiliate program did, this is not the case for June. This month we had 5 sales from the independent program, I’m not surprised since again, it’s winter month related.
This is the numbers for June.
June 2017 Earned Commission
- Amazon $1,018.76
- Affiliate program 1 – 5 sales $128.81
- Total Ordered Items: 530
- Total Commission: $ 1,147.57
To make a “fair” comparison I like to see earnings per 1000 visitors. That gives us a good number based on traffic and earnings, that we can compare.
- Dec $217.98 / 1000 visitors
- Jan $139.96 / 1000 visitors
- Feb $128.6 / 1000 visitors
- March $93.68 / 1000 visitors
- April $92.04 / 1000 visitors
- May $157.23 / 1000 visitors
- June $81.75 / 1000 visitors
This is the lowest number; we’ve seen for awhile. Can’t wait to get up to December earnings again :).
Expenses June
Outsourcing: $113
- 9 Outsourced articles ($7 each) $63
- 4 Outsourced reviews, (these are longer in-depth articles 1000 words at least, $12.5 each) $50
Hosting: $2
This site is on shared hosting, there for the low cost.
This is the hosting I suggest if you are new.
List building: $5
Aweber list building shared cost with other sites $5
Total Expenses: $120
Total Result June: $1,027.57
If we compare that to June 2016, we are seeing a good increase:
- June 2016 – $432.74
- June 2017 – $1,027.57
Total Result for the Site
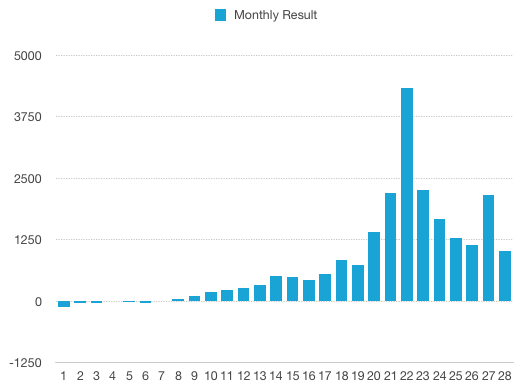
- Result Month 1 – 6: $–265.36
- Result Month 6 – 12: $817.13
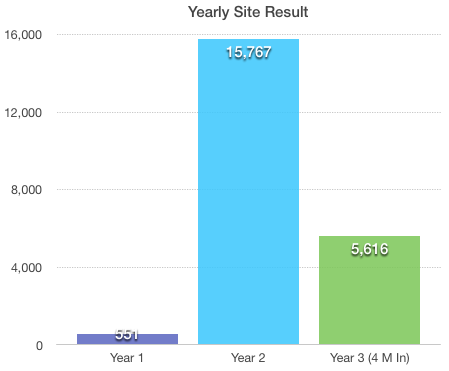
- Result Year 2: $15,767.08
- Result Year 3, 4M in: $5,616.16
Monthly Results
Exciting Future for the Site?
 Beginning of this year, we said what if we can have the same growth as we did the last year of 2016, the outcome would be very exciting.
The target is 100K if we can keep up with the growth. To stay on track we should be at 18K after six months. We are not there, we are following behind BUT the site has still earned almost 10K so far.
Total earning for 2017 of $9,919.61
I’m still hopeful for the future!
The site is earning money but I couldn’t have done it without these tools…
- Wealthy Affiliate for training and updates (Free and Premium membership)
- BlueHost (starting from $3.95 monthly)
- Jaxxy for keyword research (Free trial)
- WpZoom Theme I use for the site (Premium theme)
- EasyAzon to fast and easy include Amazon links on the site (Premium plugin)
- Aweber to collect emails (Premium tool)
- SumoMe (Free and premium for social share)
- Crowdfire for Twitter growth (Free and Premium)
- Google Analytics (Free)
- SemRush (Free and Premium)
These tools are awesome, saves me time and help me maximize earnings.

Will this site be able to make $100.000 in 2017? Follow the journey, sign up for the newsletter…
If you are new to blogging and affiliate marketing, I show you how to get started here.
Did you miss some of the old posts? You can access the old case study posts here.
To a great July 2017! Enjoy your summer!


Impressive earning. I am starting a similar case study on amazon and adsense and i hope I will be getting the same success in a couple of months/years time.
Thanks for sharing.
That’s great, let me know when you have your reports up would love to take a look.
Good luck!
Hey, some pretty neat numbers there and it looks like you are well on your way to a neat $25k for 2017 a cool $2k+ monthly and passively.
I had some concerns about the average sessions duration also (currently undergoing a traffic Tsunami! record last month 4,500+ heading for 7,500+).
I checked User behaviour–>Overview and found ave time on page was way higher than the average session. Do you have any idea what theses tow figures mean as I though ave session would be higher than ave time on page
Thank you Derek,
Congrats to your success looks like you are getting some good traffic.
As far as the Ave. time on page vs. Average time per session, was it based on the top 10 pages? Your visitors will stay longer on some pages but leave (for different reasons) faster on other pages.
Hello VIcky, Its been years since i have been with WA, i am interested in signing up again if i could get just an hour of coaching from you and if you would look at any website i start to make sure i am headed in the right direction. Could you let me know? My email and name is entered below.
I love your website
Thank you, I would be happy to help you. Let me know what I can do to help in the right direction.