 Fridays with Vicky 35
In this Niche Site Case Study, we are following one of my other sites. I show you the real traffic, rankings and sales numbers. I share what works and what doesn`t.
Today we will take a look at the 6-month update, March 1 – Aug 31. Will this site be out of the red?
Today we will also dig deeper into Google Analytics, a helpful tool that shows you the history of your site so that you can dominate the future.
In the 3-month niche site case study update, I talked about what I did to get traffic, rankings, and sales. It`s been summer. During the summer I like spending time with my kids and family. I enjoy traveling. So to be honest I have hardly touched the site the last 3 months BUT there is one thing I always make sure…
I stick with my schedule and all though I took the summer off…
I always submit fresh content to my site twice a week.
That`s what I committed to with this site, and that`s what I`m sticking to.
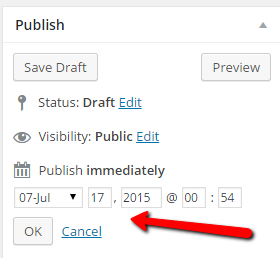
How Can I Submit Fresh Content Without Working?
My favorite feature in WordPress is the scheduling tool.
I make sure I have the content written, submit it and schedule the post for when I want it to go live.
You can read more about scheduling your posts here.
Google Analytics
After you have been using Google Analytics for a while you can get some really valuable information. This is the traffic overview for the site, March 1 – August 31.

As you can see it will not be a straight curve up, you will have some days better than others. What we are looking for is a positive trend.
The sub-niche that I started out working with is geared toward the winter months, so I`m not surprised by the few highs in August.
Age and Gender
Another thing I look at is age and gender. In the last article, I talked about targeting your audience with a visitor profile. Google Analytics can help you with that.
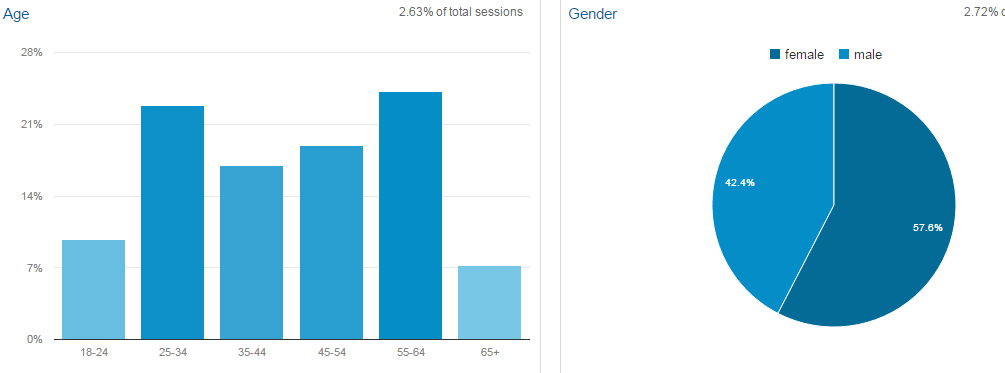
That the age group 55-64, is the biggest age group does not surprise me at all. The first sub-niche I target offers a product that suits this age group well. It also serves active people in the age 25 – 34.
PageViews
So what pages do my audience visit?
The most popular page on the site is the homepage, marked /. You will then get a list of the most popular pages and posts on your site following.
This can be a great help, to find out what`s ranking and what`s popular on your site. Keep doing more of what already works right.
I can also see that my visitors is engaged, they stay 3 minutes on average.
The bounce rate (Bounce rate a single page session) being a little high I`m not too worried about. Avg. time is good, and the bounce rate might be that they bounce over to Amazon and I have nothing against that.
Devices
Another thing I keep an eye on is the devices used to visit the site. Some of my sites have lots of mobile users and I want to make sure that the content is displayed properly no matter what device is used to visit my sites.
In this case, most people visit the site from their desktop.
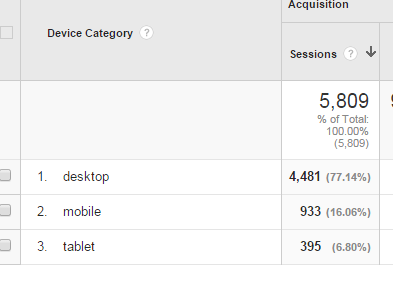
Google Analytics can be a great help to figure out what works for your site and what doesn`t. If you are just starting with a site don`t dwell too much on it, you will see the patterns over time and that way figure things out.
Click Here for More Basic Google Analytics.
Ranking Result after 6 Months
Looking at the main keyword, from sub-niche 1. The top 10 review page ranks #4 in Google, after Amazon, Walmart, and Walgreen for its keyword.
It ranks higher than Overstock, QVC, Bed Bath and Beyond and Sears. Not bad at all!
If I can keep or improve this ranking position going into the winter months then I should be able to see some increase in sales.
To check my rankings I use Jaaxy and SemRush. If you are looking for a specific keyword you can type it directly into Google and check your ranking there. I find that it saves me a lot of time using one of the mentioned services though. It also shows me what keywords I`m ranking for, keywords that I might not even have thought about.
So let`s see how the rankings are going, using SemRush.
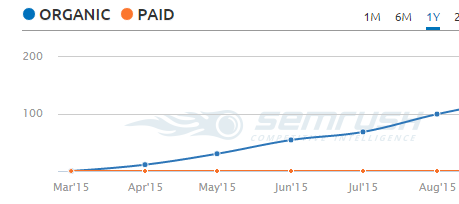
The positive trend with more and more keyword rankings.
Am I gaining or losing keyword rankings?
As we can see we gained more keywords than we lost. Log into your SemRush account and you can click on the box and check out the keywords. This can be very helpful and you can go in and give that keyword/article a boost if needed.
Traffic and Sales after 6 Months
March
- Unique page views 359
- ”Top 10 review” page view 18
- Number 1 Product review 34
- 4 Sales (2 sales directly related to the in-depth reviews)
- $7.29
April
- Unique page views 625
- ”Top 10 review” page view 62
- Number 1 Product review 81
- 7 Sales (5 sales directly related to the in-depth reviews)
- $18.59
-The reasons the number 1 review is getting more views than the top 10 is because the review was written and submitted first.
May
- Unique page views 1313
- ”Top 10 review” page view 114
- Number 1 Product review 97
- 6 Sales (3 sales directly related to the in-depth reviews)
- $10.95
June
- Unique page views 1510
- ”Top 10 review” page view 112 – unique page views 92
- Number 1 Product review 78
- 15 Sales (13 sales directly related to the in-depth reviews)
- $47.22
July
- Unique page views 1690
- ”Top 10 review” page view 186 – unique page views 155
- Number 1 Product review 90
- 9 sales (8 sales directly related to the in-depth reviews)
- $33.55
August
- Unique page views 1161
- ”Top 10 review” page view 239 – unique page views 178
- Number 1 Product review 111
- 8 sales (7 sales directly related to the in-depth reviews)
- $22.04
I see a positive trend when it comes to page views and unique page views. I`m also excited about the Avg. Time on the review pages, around 3.30 min.
Conversions
Let`s look at the conversions. I`m taking the top 10 review page, the unique page views and see how many sales they generated.
- June 14.1%
- July 5.2%
- August 3.9%
So this is a downhill trend that I need to keep an eye on, not too happy about this. Although 14.1% is really good in June the number in August is not. There can be many reasons for this. In June, for example, I had some buy more than one item of the same order.
I also had some “spam crawlers” that might have pushed down the August conversion rate, will be looking into that more. In the next niche site case study I will show you how to exclude the “spam crawlers”.
The conversion number going down is definitely something to keep an eye on though.
Amazon Website Sales
Income month 4-6: 102.81
Expenses
Expenses Month 4 – 6
- Content outsourced $48
- Pictures for blog posts $8
- Total: $56 / month
- Total Month 4-6: $168
I`m excited that I almost, almost broke even with the outsourced content in June.
Result Month 1 – 3: -200.17
Result Month 4 – 6: -65.19
Total result after 6 months: -265.36
Although I`m still in the red with this site, I have big hopes for it coming the winter months. Sub-niche 1 that I work with is geared toward the winter months, it`s a little bit of a seasonal product. So this one should start climbing and get out of the red as we approach some cold weather. Sub-niche 2 will be an all around year product, so come next year at this time, this niche will help even out the income.
Goals for the 9 Month Mark
Content
- I will continue submitting outsourced posts 2 times weekly.
- Also, want to submit a couple of new pillar articles.
Traffic
- I did reach the goal of reaching 1500 for this period. So for the 9-month mark, 2000 visitors monthly are my goal.
Financial
- I did reach the 10 monthly sales although I had a little dip in August. Reaching 20 monthly sales going into the colder months is my goal.
- Also looking to be out of the red with the site.
To Do List Going Forward:
- Create 3 more pillar articles Top 10 or Top 5
- Start building an email list
- Come up with a good ”give away” for the list
- Start building relationships in the niche. Start interacting with other blogs in the same niche.
- Use social media more actively
Hope you enjoyed this 6-month case study. If you want some tips and ideas how to dominate and make money with Amazon click here.
Did you miss these posts?
- How to set up your niche site for success.
- 3 Month Update
- 9 Month Update
- 1 Year Update – the site is getting traction
- Latest Case Study Update Click Here!
I would love to hear your take on it, feel free to leave a comment below,
Have a productive day,


I like the idea of this case study. It really does show that affiliate marketing can work if you keep at it and set goals. Nothing happens overnight so patience is key in this process. Looking forward to the next update.
Hi Melody,
You are right it will not happen over night, but if you stay consistent, stick with it and provide value to others it will work.
It`s not a sprint…
I`m also excited to see where this site goes, we are in this together,
Vicky
Thanks for the in-depth look at Google Analytics! Honestly, all the information I see when I log in to my account overwhelms me, so it was good to know what to look for and what it means!
I’m sure conversions will pick up in the winter months! And I think summer is slow for everyone anyway, since so many people are on vacation. And when the winter comes around, people will find your site that already has a few months of history!
Hi Samantha,
I know that Google Analytics can feel overwhelming, I have in the plannings to do a more in-dept post about it.
Conversions goes up and down and especially in the beginning when you test and try different things. I`m sure when the site has gotten some age to it, it will give me a more accurate number to work with.
Thank you for taking the time to read and commenting,
Vicky
Hello once more Vicky,
Great to see yet another one of your very informative posts. I use google analytic from time to time, I know its important, but this morning I was saying to myself: I should focus more on creating content than looking at my stats every single time although it is so important.
I however like the way you outlined to us how easy it is to navigate using google analytic and also understanding the Amazon website sales. I will surely be back on your site soon and will be more than happy to share my opinions.
All the best again Vicky.
Best,
Jason.
Hi Jason,
Thanks for your comment. I do NOT suggest spending too much time on checking stats, especially not in the beginning when you don`t have much to track. It is easy to get into bad habits, checking non existing stats when like you say focusing on the content should be your major priority.
Focus on things that will move your site forward, content, networking, social… then when the stats are there, take a look.
Thanks for stopping by Jason, appreciate it,
Vicky
hi Vicky!
So interesting to look at all the data for your site in the past 6 months! I never thought to do such a thing with my site. I use Google Analytics on a daily basis (what a great tool!) but never thought to use it to look at data over months. I need to try that out right now! It seems like your site is doing great as you were selling right from the first month. Understandably there are expenses associated but you are making sales. If you have a site that is winter related then it makes total sense that things would pick up in the upcoming months.
Hi Emily,
Looking at your site long term you can see how it really develops. As online marketers we can be so hard on ourselves and expect great results right off the bat. Looking at your site and results over a longer period of time where you see the growth and improvement can actually be a great motivator (as long as the site increase :).
Since I do outsource the content it will take a few extra months before I break even and become profitable but that`s ok, when I`m there it will be well worth it! I`m excited to see what the site can do during the winter months, for sure.
Thanks Emily for stopping by and commenting,
Vicky
Vicky, I really enjoyed reading your 6 month update and learning a lot about Google Analytics. The reports are pretty confusing if you don’t understand what you are looking for. I feel sure that I will be visiting this page over and over until I get all this information down. This is a very educational article.
Blessing to you,
Diane
Thank you Diane!
Yes Google Analytics can be confusing if you don`t know what to look for.
I plan on doing more case studies and Google Analytics posts as well.
Let me know if you have any specific questions about Google Analytics and I will be happy to help,
Vicky
Nice work Vicky! You managed to keep your readers engaged, I’m really impressed with your results. My average session duration is only about 1min-1min20s, do you have any tips for me to increase visitor engagement? Thanks so much and all the best to your success! 🙂
Hi Gin,
There are a few things to look at.
1. Make sure you don`t have “spammy” robot visitors that will visit and jump off your site right away. These can improve numbers but they will shorten visitor duration. If they are not “real” users you don`t want them on your site anyway.
Working on a post on how to spot them and how to get rid of them…
2. Make sure you have content that engage. Make it easy to read, ad in pics and videos where suitable.
3. Depending on your goal for your site, you might not mind if they click through to for example Amazon. Some pages on your site might have a shorter session duration because they are actually doing what you want them to do, go to Amazon for example. Go in and check the session duration for the pages that you want them to stay on and engage and see if they stay longer on those.
Hope that helps,
Vicky
Very insightful case study – thanks for sharing as it highlights a lot of challenges I will be facing as I get my website up and running as well. Cheers!
It`s always good to know what`s coming!
Stay persistent, create great content and be patient!
Vicky
Hey Vicki, this is a great article. I think a lot of folks can learn a lot about how to learn what is trending on your site by using google analytics.
My day job is for a large eCommerce platform. Roughly 70% of our sales come form mobile devices these days with iPhones having the larger market share. Our consumers are mostly younger, ranging in age from 16 – 25. I can say that everyone should be creating their sites to be optimized for mobile viewing because as that generation gets older, I believe that trend will continue.
This certainly is a thought provoking article. Thanks for writing it.
The key here is to know your audience, don`t guess but use tools like Google Analytics to know your audience. In this case study still 77% visit the site from a desktop. That`s because the audience is more mature. The statistics for this site itsvicky.com would be completely different.
I agree that the trend o using mobile and tablets, is here to stay.
We want to make sure that no matter what device visitors use, they get a great experience on our sites.
Thanks for your input Christian and for sharing your own experience,
Vicky
Vicky